

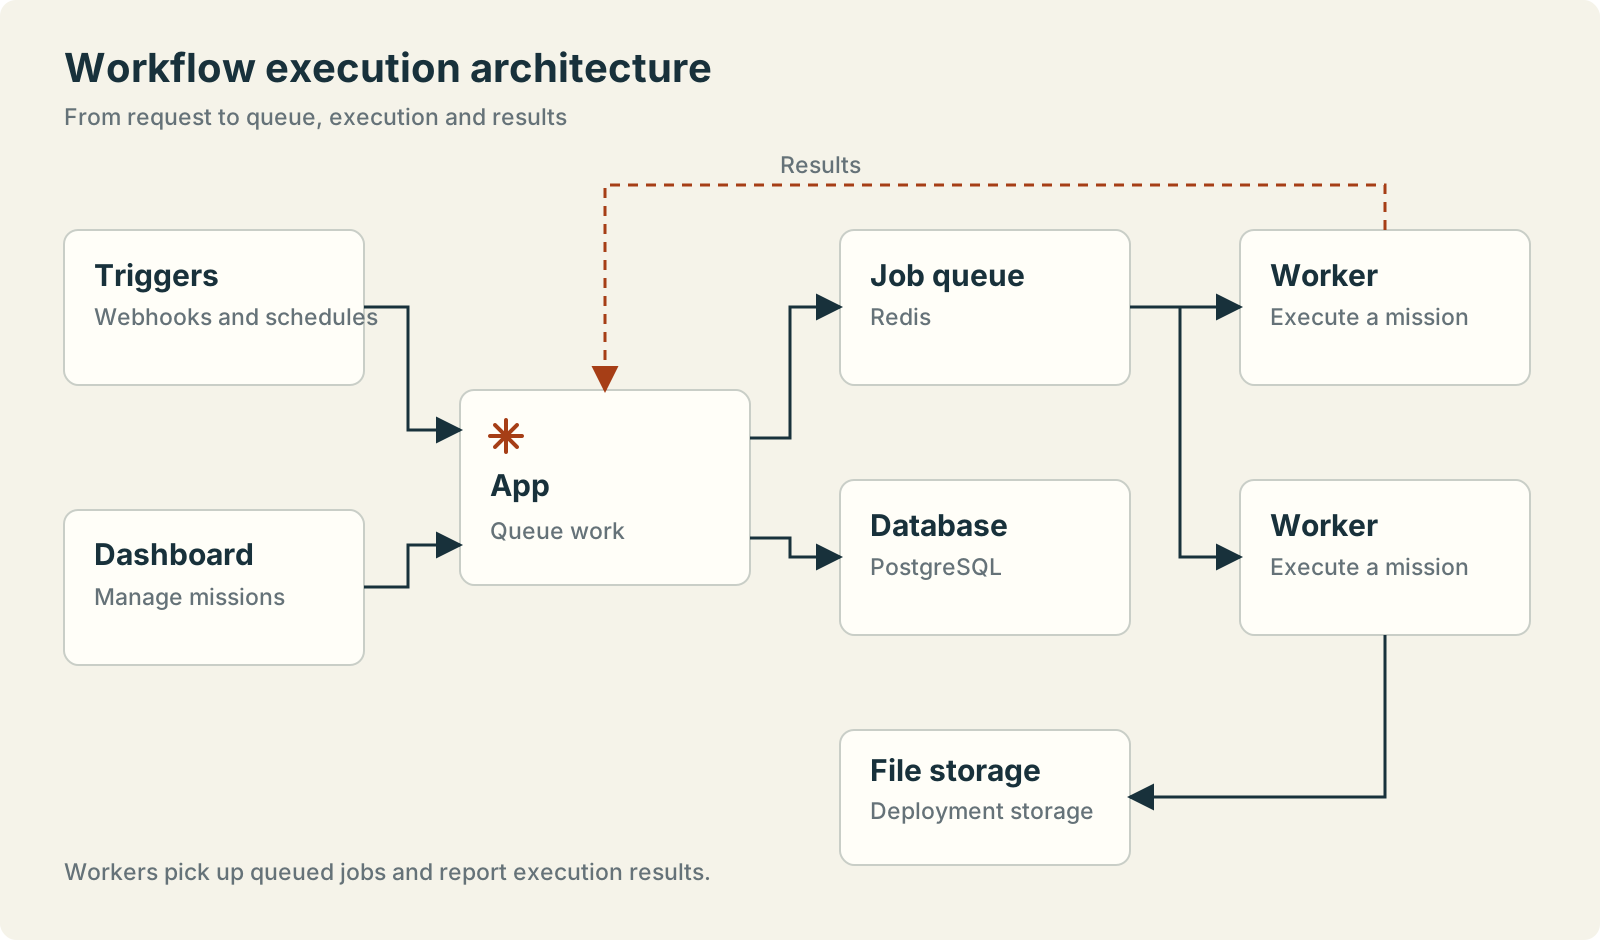
 The schematic shows the shared workflow components. The historical benchmark used S3 and a one-flow-per-worker execution tier.
What’s measured
A 4-node synchronous webhook flow that holds the HTTP connection open until the flow returns:1
Webhook trigger
Catches the request on a
/sync URL and holds the connection until the flow finishes.2
Math Helper
Adds
2 + 3.3
Code step
Runs
return inputs.sum + 1 inside an isolated-vm context.4
Webhook response
Returns the result, closing the held connection.
AP_REUSE_SANDBOX=true) - the engine process is reused between jobs.
Results
777 req/s
Peak warm throughput - 16 apps, 160 workers.
6.1 req/s
Best per-worker rate, at 80 workers. It falls to 4.9 by 160 - adding workers keeps adding throughput, but less of it each time.
What each tier ran - and what it was actually doing
Only the app and worker counts scale (1:10). Postgres and Redis are a single fixed-size pod each - the same for every row below. CPU is sampled every 3 s throughout the measured pass; the singletons’ figures are the whole pod, app/worker are per pod. Read the two right-hand columns differently from the two on the left. Only the worker has a CPU limit (requests == limits == 500m, a hard cap). Postgres, Redis and the app declare CPU requests - a scheduling reservation they may burst above on a node with spare cores - so their numbers show what each tier consumed, not how close it came to a ceiling.
Postgres is by far the fastest-growing tier. It climbs 529m → 2738m as the fleet quadruples - 5.2× the CPU for 4× the workers - and ends up the single largest CPU consumer in the deployment, in a single pod (the worker fleet consumed about 14.6 cores in aggregate, compared with 2.7 in the database pod). Its cost per unit of work is near-constant (~2.5 millicores per req/s at every tier), so it grows with throughput, not with fleet size, and no configuration makes it stop growing. Redis behaves the same way (123m → 781m).
By contrast the workers - the only hard-capped tier - sit at ≤0.1 of their 0.5-core cap at every fleet size, and apps hold steady at ~0.52-0.61 of a core per pod because the 1:10 ratio adds app capacity in step with the load.
The singletons here are deliberately generous (3 vCPU request,
max_connections=2000, durability off, data dir on tmpfs). A managed Postgres at the 2 vCPU / 4 GB this documentation recommends, with fsync on and real disks, does less work per commit than this one and will feel the same load sooner. Size the database against your peak throughput, not against your worker count.How throughput scales
Adding workers always adds throughput, but the return per worker falls after ~80. Total throughput goes 213 → 484 → 641 → 777 (3.6× for 4× the fleet). Per worker that is 5.3 → 6.1 → 5.3 → 4.9: the rate peaks at 80 workers and then gives back about 20%. Two things are happening at once:- Below ~80 workers the fleet is still filling out. 40 workers cannot push enough concurrent work to use the tiers behind them, so the per-worker rate is not yet at its best. This is why the 40→80 step is super-linear (2.27× throughput for 2× the fleet).
- Past ~80 workers, per-flow time stretches. The measured
sandbox runphase goes 146 ms at 80 workers to 181 ms at 160, so each worker completes fewer flows per second even though it is nowhere near its CPU cap. Something shared is absorbing the extra concurrency, and database CPU is the tier visibly growing with it (see the caveat above - growth is measured, causation is not).
workers ÷ per-flow-time. That is linear in the fleet only while per-flow time holds constant, and past ~80 workers it does not. (The synchronous response reaches the client sooner than that - it is sent at the response step, before the worker wraps up the log write - so client-perceived latency is lower than the worker-busy time that sets throughput.)
What this means for sizing: worker count is the right lever up to roughly this scale, but do not read the worker fleet as the only dial - the shared tiers behind it grow with throughput and need to grow with you.
Why Production Setup recommends 1:10. Apps at 1 vCPU are cheap relative to the worker fleet, and 1:10 is the warm-headroom margin that keeps the app tier from becoming the wall during bursts - it holds here, with apps steady at ~0.6 of a core per pod at every tier. See Production Setup.
Latency anatomy
Where the worker’s milliseconds go - warm at peak (16 app · 160 w), averaged over all 64,000 measured runs:
Warm provisioning and boot are effectively free - the piece cache is on local disk and the engine process is reused, so essentially the entire worker-busy time is the flow run itself. That figure grows with the fleet (167 ms at 40 workers, 146 ms at 80, 167 ms at 120, 181 ms at 160), which is the per-flow stretch behind the falling per-worker rate above.
This is the time the worker is occupied per job - and at concurrency 1 it is what sets throughput (
workers ÷ worker-busy-time). The synchronous client sees less: the response is published at the flow’s response step, before the worker finishes persisting the run log, so client-perceived latency runs below the worker-busy figure. At peak the in-cluster client measured p50 180 ms, p95 288 ms, p99 652 ms.
Test environment
- Cluster: GKE
n2-standard-16× 10 nodes,europe-west1-b - Worker: 0.5 vCPU / 1 GB, concurrency 1,
SANDBOX_CODE_ONLY(Node fork +isolated-vm). Idle RSS ~145 Mi - App: 1 vCPU / 1 GB
- Object store: same-region GCS bucket (
europe-west1) over the S3-interop endpoint, path-style SigV4 presigned URLs (AP_S3_USE_SIGNED_URLS=true) - Piece bundles: official tarballs served from the upstream Activepieces CDN (
AP_USE_CDN_FOR_BUNDLES=true; the default isfalse, which serves from npm) - Postgres + Redis: in-cluster singletons, deliberately generous - Postgres requesting 3 vCPU / 3 GB with
max_connections=2000(the default 100 would starve the app pools past ~10 apps), durability off, and its data dir on tmpfs; Redis requesting 2 vCPU / 2 GB withio-threads. Neither has a CPU limit, so both may burst above their request; Postgres consumed 2738m at the top tier - Load:
heyrun inside the cluster, against the app Service, concurrency matched to worker count (40/80/120/160) so requests don’t queue behind the concurrency-1 workers - latency reflects real service time, not backlog. 400 requests per worker per tier (16k/32k/48k/64k), preceded by an unmeasured warmup pass