

This is an upstream technical reference retained from the pinned documentation revision. Its diagrams, timings and implementation details are not measurements or release guarantees for Sydekyks. Validate differences against the selected fork release before using it operationally.
Scope: the recommended production setup (
SANDBOX_CODE_ONLY, AP_REUSE_SANDBOX=true, one flow per worker), which self-hosted deployments and dedicated Cloud workers run. The shared Cloud freemium pool uses a different sandbox. See Production Setup.What to expect
Warm vs cold
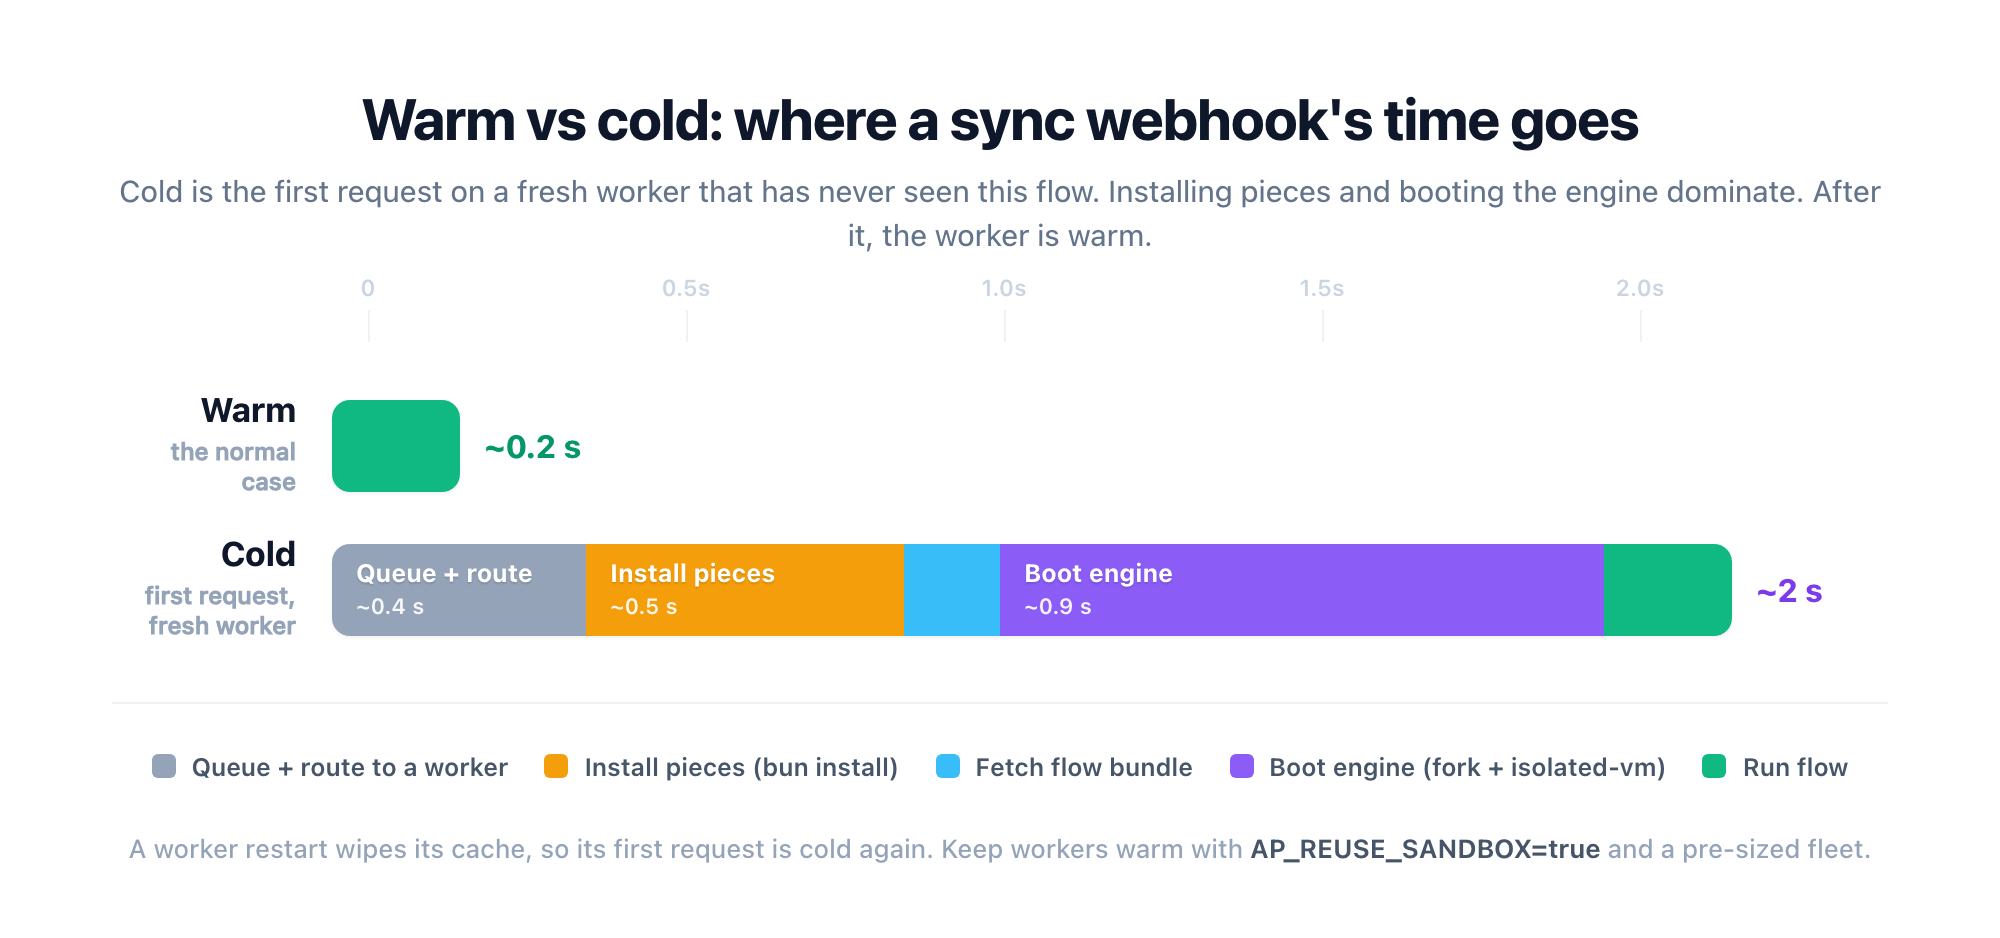 Cold means a worker that has never seen this flow: it installs the pieces, fetches the bundle, and forks an engine first. Warm reuses all three. You hit cold when:
- It is the first request after a deploy, restart, or scale-up.
AP_REUSE_SANDBOXis off (then every request is cold).- A burst exceeds your warm worker count. Each worker runs one flow at a time, so the surplus queues or starts cold.
Per-run breakdown
Every run records where its wall-clock time went, shown as a four-phase bar. To view it, open any run and hover the info icon next to the run’s duration (“Took”) in the run header. The phases run in order:
Queue, Setup, and Warm-up are the orchestration around your flow; Run is the flow itself. On a warm worker the first three collapse toward zero - the reused sandbox is already booted, so Warm-up is ~0 - and the bar is almost entirely Run, which is why warm calls are dominated by your own work.
Where the Run phase actually goes
For a flow that does real work - a step calling a third-party API - that outbound call dominates Run, and the Sydekyks overhead is the smaller number next to it. For a bare flow (no external calls), Run is mostly persisting the run, not executing it. A production run makes a fixed set of network round-trips to the app and object store, independent of step count:- Two log-backup writes to your object store (S3/GCS) - an initial snapshot and a final one. With signed URLs on, each is a direct worker→object-store upload. On a warm in-region cluster this is the single largest slice of Run (measured ~45% of worker-busy time); on a distant or public object-store endpoint it grows proportionally.
- A handful of worker→app callbacks (send-response, run-log metadata) - each roughly one worker→app round-trip. Database and Redis touches ride inside these and are a few ms each.
Measured (warm)
Four-step flow (webhook, math, code inisolated-vm, response), single warm call, no contention:
The same setup measures ~165 ms unloaded and ~200 ms average under sustained peak (160 workers, p50 180 ms / p99 652 ms): the shared database absorbing load, not the flow slowing. Always ask which load a figure was measured under. Throughput view: Benchmark.
Reduce it
- Keep workers warm:
AP_REUSE_SANDBOX=trueplus a statically sized, always-on fleet. - Put the object store next to the workers: a bare warm run spends most of its Run phase on two log-backup writes to S3/GCS. In-region, same-zone, private connectivity to the object store is the biggest lever on that overhead - a distant or public endpoint multiplies it.
- Size for peak concurrency: N concurrent requests need N warm workers (sizing).
- Fewer, heavier steps: each step adds overhead.
- Don’t let a slow third party block the response: use an async webhook and callback instead of holding against the 30 s ceiling.